Network Usage Analysis at Student Residence
Overview
Since the setup of student residence in year 2000, the number of users has grown from 800 to about 2800 this year. Furthermore, with the completion of phase 4 early next year, the number of residents will be further increased to around 3500. With the increase in the population and difference in network and application usage, it is mandatory for the Computing Services Centre (CSC) to regularly analyze the network traffic patterns in the student residence in order to allow better planning of network capacity and to establish baseline figures for proactively detection of impending failures or performance problems.
This article shows the findings from the network traffic analysis in the student residence from 27-Mar-2011 to 3-April-2011, the period of peak usage. This enabled us to collect enough data to analyze the usage behavior and pattern. The analysis will base on the following areas:
- Daily/Weekly Internet traffic pattern in student residence
- Network application usage in student residence (Top 30 Applications found in student residence)
- Comparison of Internet traffic of student residence with that of other services/departments in CityU
- Bandwidth usage of wireless LAN and student residence
Daily/Weekly Internet traffic pattern in student residence
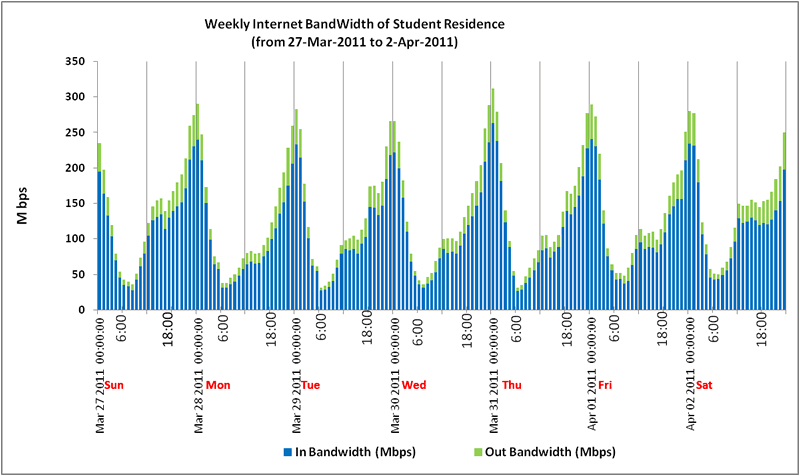
This analysis shows the daily Internet traffic pattern of the hostel residence for one whole week:
|
Figure 1 Daily Internet Traffic Pattern in Student Residence |
- Traffic is peak at midnight everyday
- Traffic reaches its minimum at around 6:00am / 7:00am everyday
- During day time (06:00am to 18:00), the traffic is increasing steadily (at a lower rate)
- Traffic is increasing sharply from 18:00 to mid-night
- After midnight, the traffic is decreasing rapidly to a minimum at around 6:00am / 7:00am
- The Peak Internet traffic on Saturday and Sunday is slightly less than that on weekdays
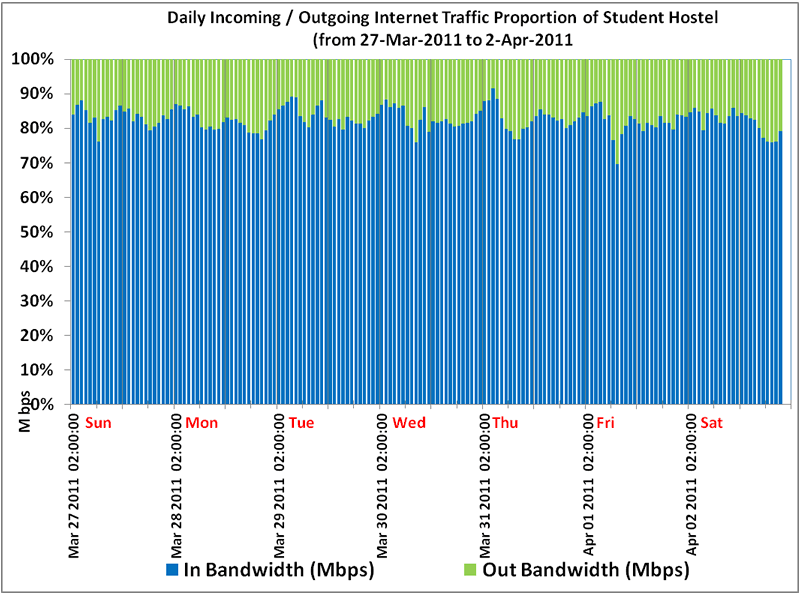
- Incoming Internet traffic is much higher than the Outgoing Internet Traffic. The ratio of Incoming to Outgoing is about 80% to 20%. Please refer to Figure 2 below.
|
Figure 2 Daily Incoming / Outgoing Internet Traffic Proportion in student residence |
Network application usage in student residence (Top 30 Applications found in student residence)
The following section shows the network application usage pattern in student residence.
|
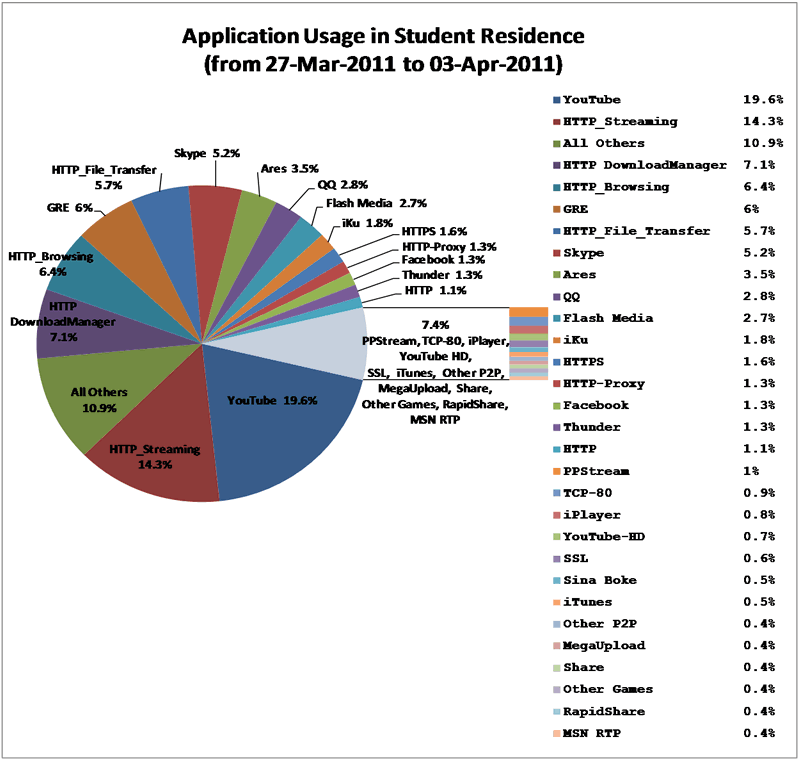
Figure 3 Network Application Usages in Student Residence |
With reference to Figure 3 above, the following shows the analysis of the Network Application usage in student residence.
1. YouTube is the top application in Student Residence (19.6%)
2. Video Streaming is the most common application category ( 38.2% )
- YouTube (19.6%)
- HTTP Streaming (14.3%)
- iKu (1.8%)
- PPStream (1%)
- iPlayer (0.8%)
- YouTube-HD (0.7%)
3. HTTP is the most common network protocol (38.8%)
- HTTP Streaming (14.3%)
- HTTP Download Manager (7.1%)
- HTTP Browsing (6.4%)
- HTTP File Transfer (5.7%)
- HTTPS (1.6%)
- Facebook (1.3%)
- HTTP Proxy (1.3%)
- HTTP (1.1%)
4. The most common P2P applications are: (P2P application: 11.4% of Internet traffic in student residence)
- Skype (5.2%)
- Ares (3.5%)
- Thunder/XunLei (1.3%)
- PPStream (1%)
- Other P2P (0.4%)
5. The most common Instant Messaging (IM) application is QQ (2.8%)
6. GRE VPN tunnels are detected and they consume 6% of Internet traffic in student residence
Comparison of Internet traffic of student residence with that of other services/departments in CityU
This section shows the portion of Internet traffic of student residence and other services/departments in CityU
| 1. Student Residence consumes 31.3% of the total consumed Internet Traffic of CityU 2. The Internet Traffic of Student Residence (31.3%) is nearly equal to the Internet Traffic consumed by all other user departments (36.9%) 3. Student Residence plus Wireless LAN consume about 45% of the total consumed Internet Traffic of CityU Bandwidth usage of wireless LAN and student residence 1. The wireless LAN traffic is increasing rapidly during day time from 9:00am to 18:00 2. During day time, the wireless LAN Internet traffic is greater than that of student residence which is consuming at a low rate, less than 100M bps 4. As a result, the Internet traffic of wireless LAN and Student Residence is complementing each other. The student residence consumes the released bandwidth from the wireless LAN after office hour. Thus, it reduces the total Internet usage of CityU 5. The sum of peak network traffic of wireless LAN and Student Residence is about 300 Mbps |
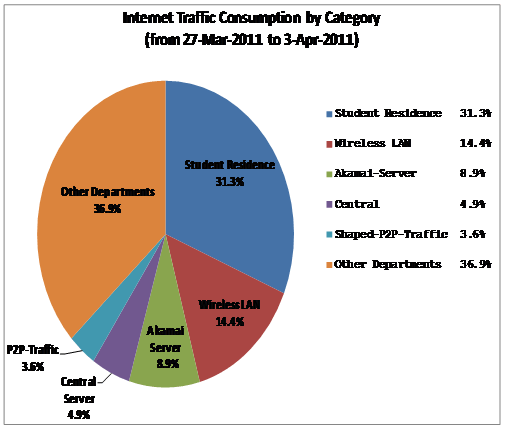
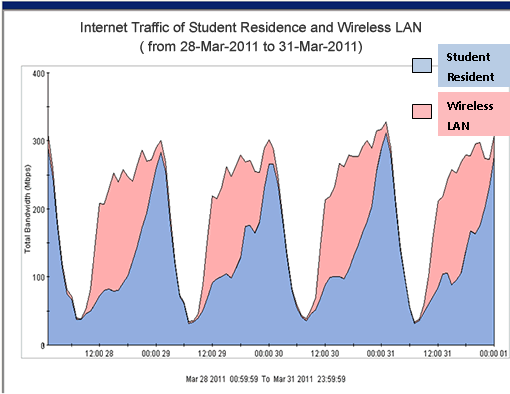
Figure 5 Internet Traffic of Wireless LAN and Student Residence
|
Summary
From the above analysis , we can summarize some interesting findings:
- Nearly 31% of the total consumed CityU Internet bandwidth is consumed by users in student residence. This is nearly equal to the sum of all Internet usage (36.9%) of all other services/departments in CityU
- Video streaming is the most popular application category in student residence, consuming 38% of Internet traffic of student residence (or 14% of the total consumed CityU Internet bandwidth)
- About 11.4% of Internet traffic in student residence are of P2P in nature
- The wireless LAN and student residence consume about 45% of the total consumed Internet bandwidth of CityU
- The peak traffic for student residence is between 18:00 to mid-night. Usage during the normal business hours is not affected
With these figures as well as other figures to be collected and analyzed, it is hoped that we can in future provide speedier trouble-shooting or replies to enquiries on network performance problems at student residence.