Working Examples
-
Here, the use of our programs is demonstrated:
Firstly, we create three ideals signals, namely y, x1 and x2. y comprises of sine waves of period
t=[-100:1:100]; y=sin(t*2*pi)+sin(t*2*pi/4)+sin(t*2*pi/8)+sin(t*2*pi/16)+sin(t*2*pi/32)+sin(t*2*pi/64); x1=sin(t*2*pi/4); x2=sin(t*2*pi/16); |
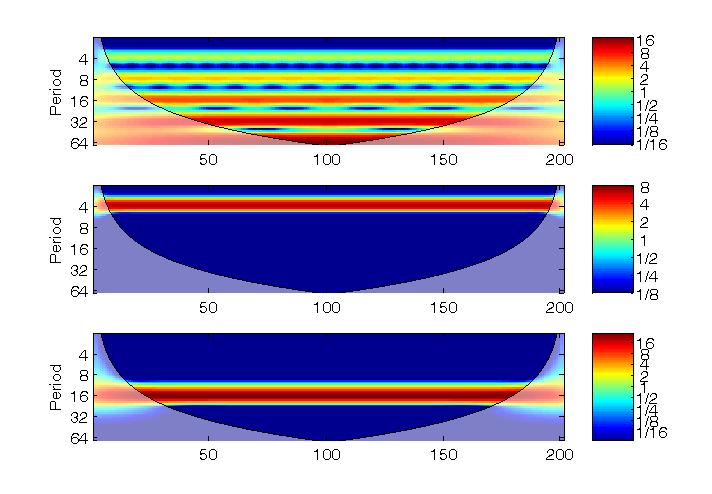 |
subplot(3,1,1); wt(y); subplot(3,1,2); wt(x1); subplot(3,13); wt(x2); |
The partial wavelet conherence squared on y and x1 to reveal their stand-alone relationship (after the removal of the influence of x2):
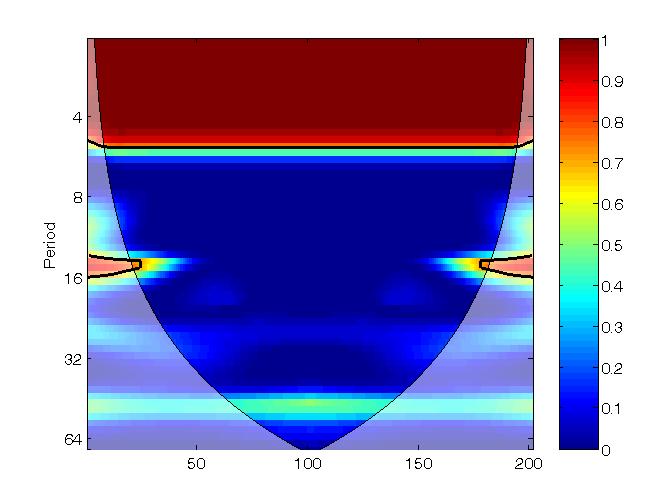 |
pwc(y, x1, x2); |
The multiple wavelet coherence squared of y, x2 and x1, which gives the resulting wavelet coherence squred that computes the proportional of wavelet power of the y explained by x2 and x1:
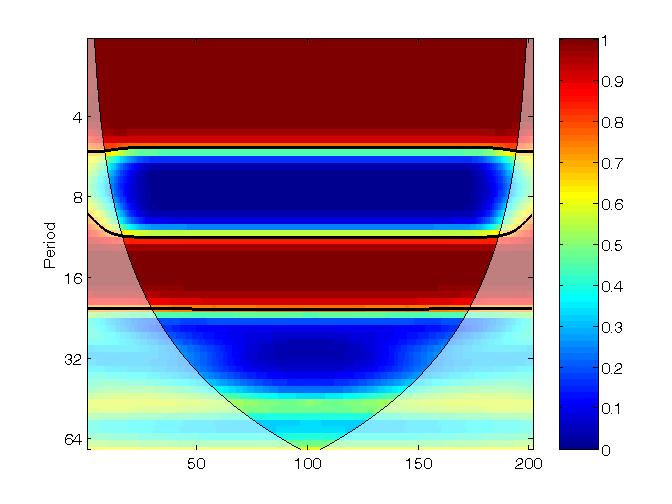 |
mwc(y, x2, x1); |
The bias problem of wavelet power spectrum found in previous software packages (top) is rectified (bottom) according to Liu et al. (2007):
 |
subplot(2,1,1); wt(y); subplot(2,1,2); wtrec(y); |
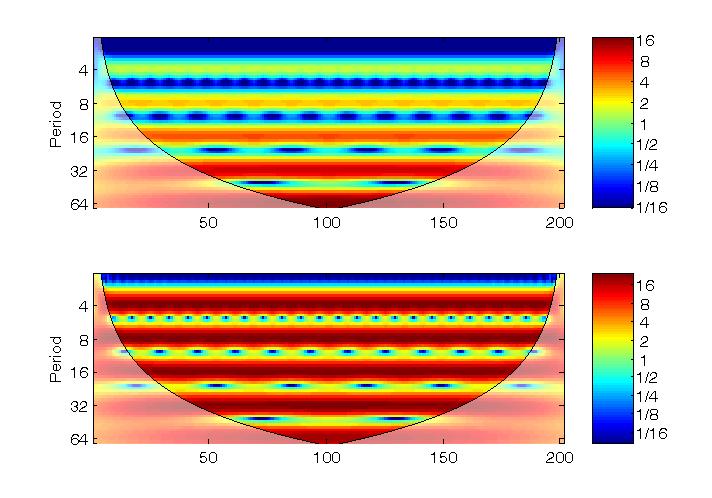
The bias problem of wavelet power spectrum found in previous software packages (top) is rectified (bottom) according to Veleda et al. (2012):
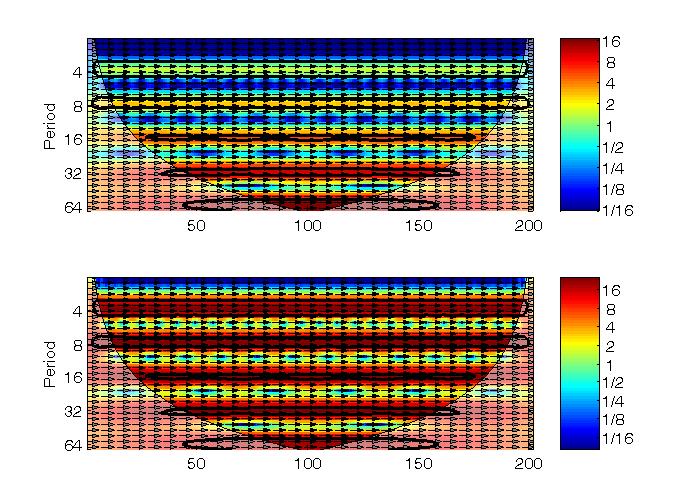 |
subplot(2,1,1); xwt(y,y); subplot(2,1,2); xwtrec(y,y); |
Should you have any enquiry, please feel free to contact:
Eric K. W. Ng
Email:
E.Ng@cityu.edu.hk