Published on Science Advances (21 October 2022)
Author(s): Xiaodong Zheng, Wei Han, Ke Yang, Lok Wing Wong, Chi Shing Tsang, Ka Hei Lai, Fangyuan Zheng, Tiefeng Yang, Shu Ping Lau, Thuc Hue Ly, Ming Yang, Jiong Zhao
Abstract
Phase transitions in two-dimensional (2D) materials promise reversible modulation of material physical and chemical properties in a wide range of applications. 2D van der Waals layered In2Se3 with bistable out-of-plane ferroelectric (FE) α phase and antiferroelectric (AFE) β′ phase is particularly attractive for its electronic applications. However, reversible phase transition in 2D In2Se3 remains challenging. Here, we introduce two factors, dimension (thickness) and strain, which can effectively modulate the phases of 2D In2Se3. We achieve reversible AFE and out-of-plane FE phase transition in 2D In2Se3 by delicate strain control inside a transmission electron microscope. In addition, the polarizations in 2D FE In2Se3 can also be manipulated in situ at the nanometer-sized contacts, rendering remarkable memristive behavior. Our in situ transmission electron microscopy (TEM) work paves a previously unidentified way for manipulating the correlated FE phases and highlights the great potentials of 2D ferroelectrics for nanoelectromechanical and memory device applications.
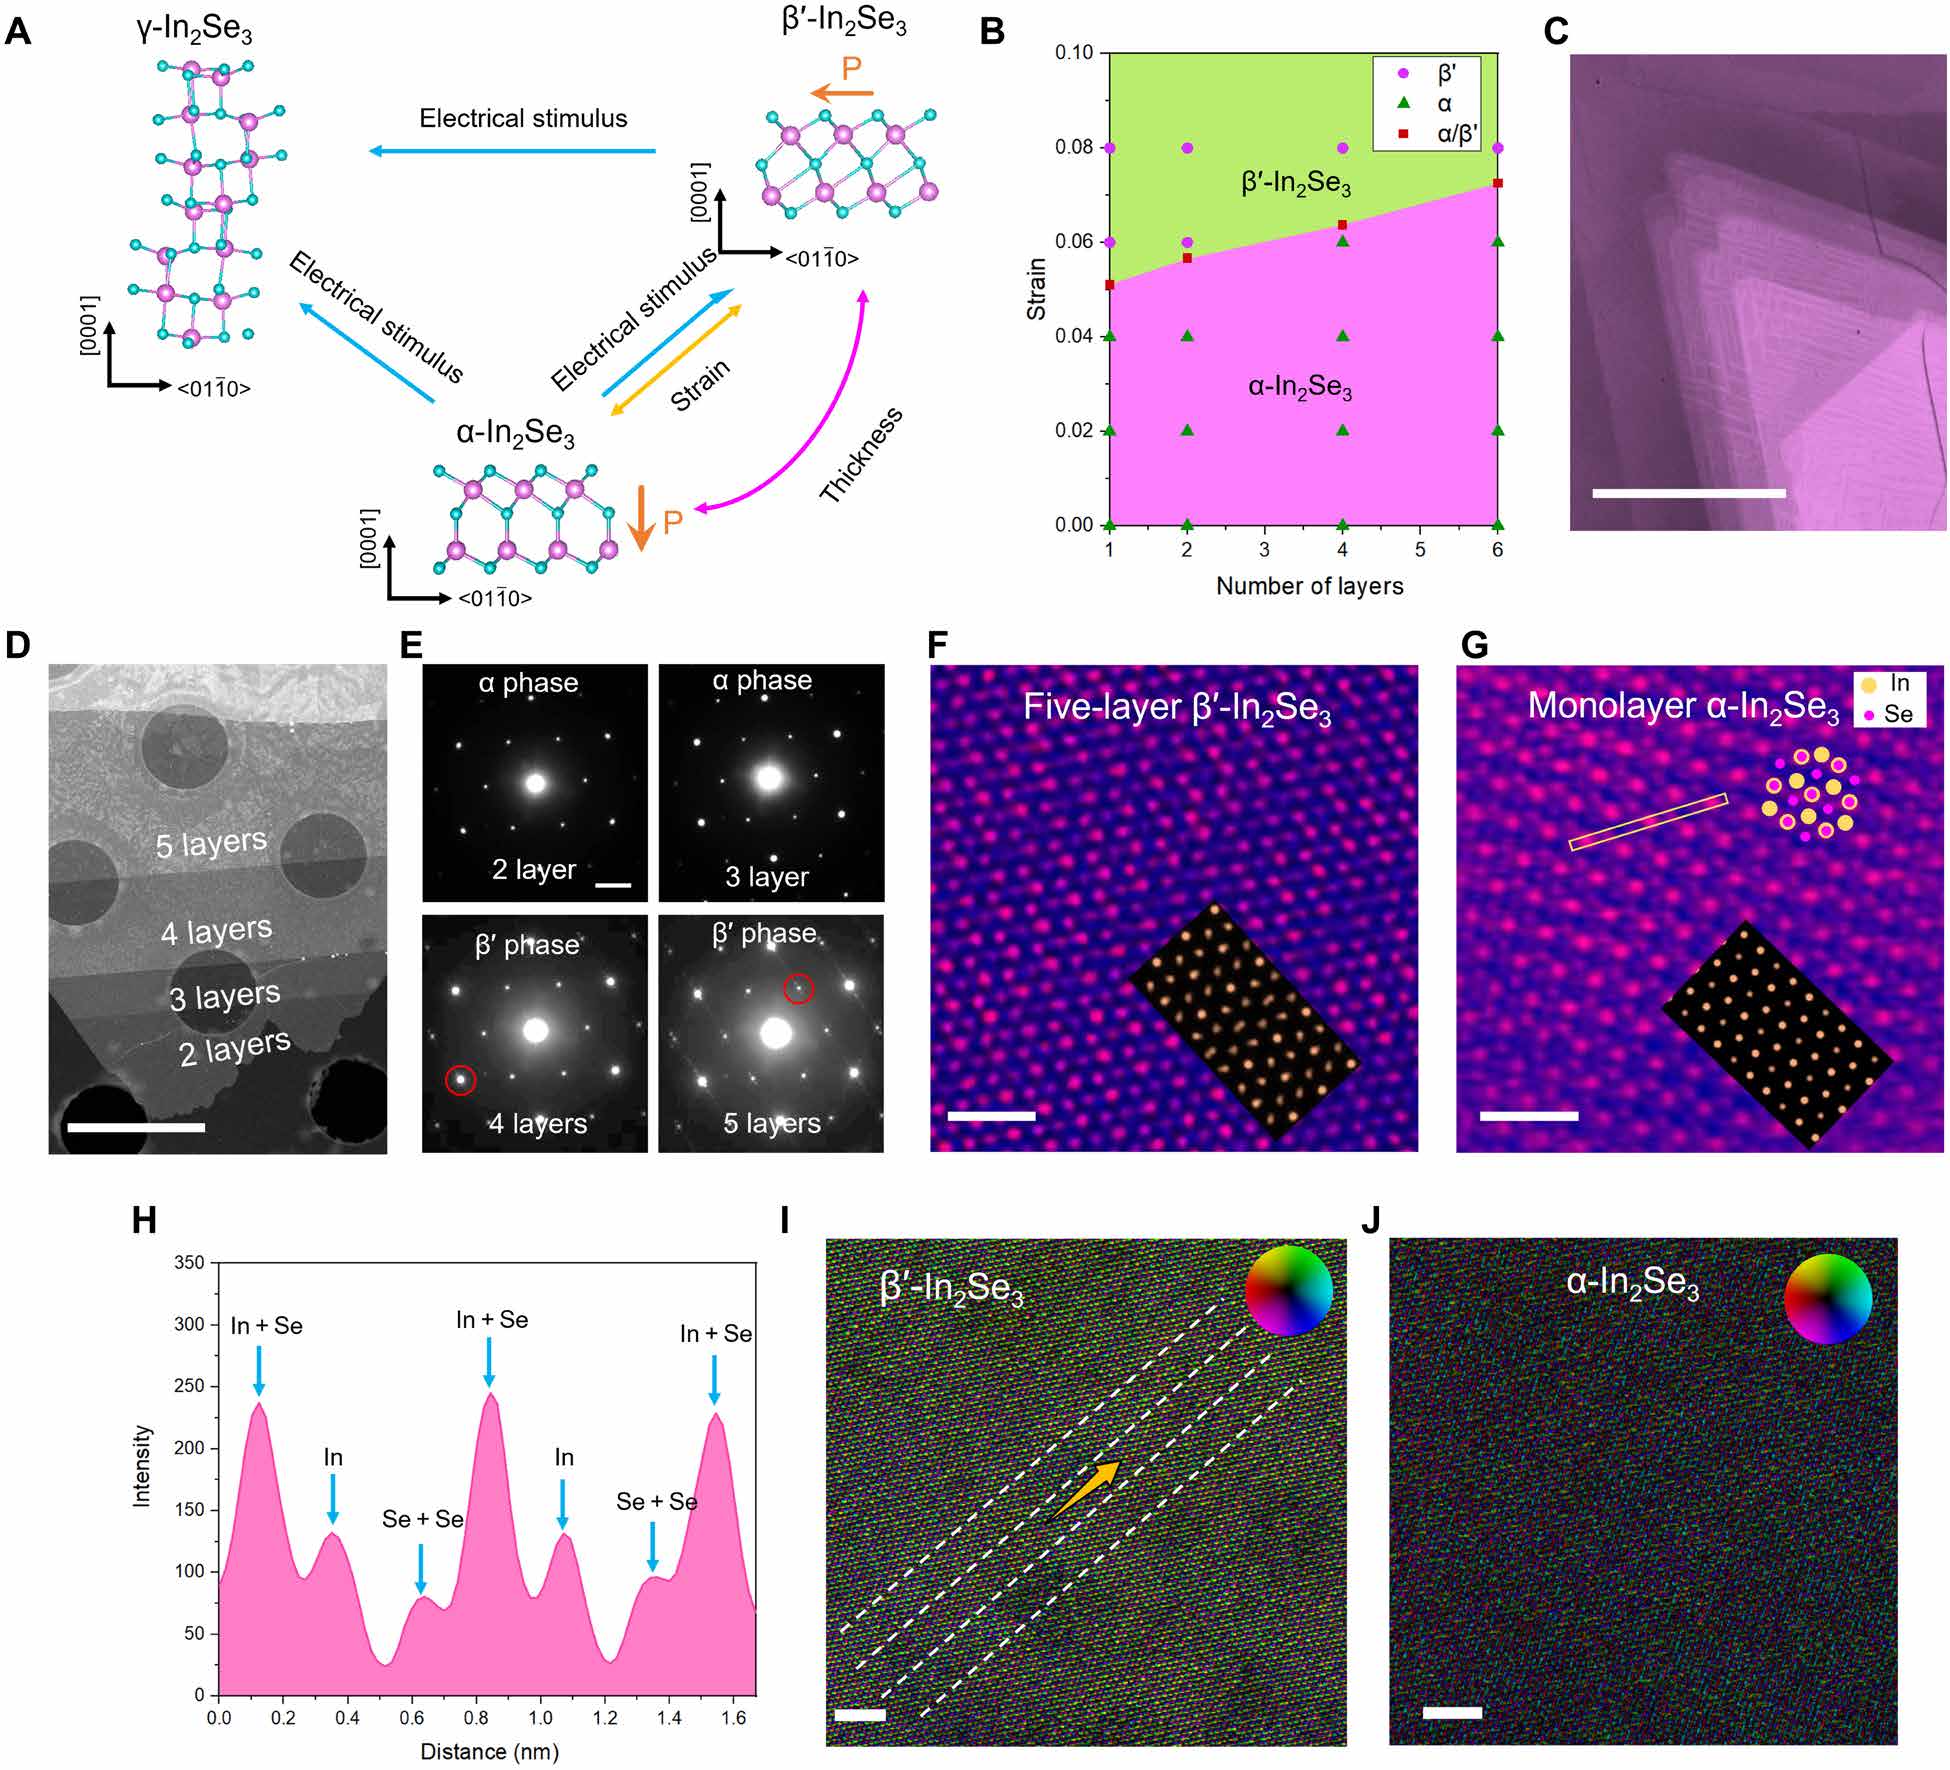
Fig. 1. Phase evolutions and thickness dependence of 2D In2Se3. (A) Atomic scheme of the phase transitions in 2D In2Se3. (B) Phase diagram of α-In2Se3 and β′- In2Se3 on strain and layer number, obtained by DFT calculations. (C) Polarized-light OM image at the polarizer azimuth angle φ = 70° presenting the typical gradient morphology of β′-In2Se3. (D) HAADF image of the edge of the β′-In2Se3. (E) The SAED patterns corresponding to the 2L-5L In2Se3 respectively. The superspots (red circles) of In2Se3 disappear for layer number less than four. (F) Atomic HAADF image and corresponding image simulation results of few-layer β′-In2Se3. (G) HAADF image and corresponding image simulation results of 1L α-In2Se3. (H) Intensity line profile corresponding to the line in (G). Atomic differential phase contrast image of (I) β′-In2Se3 phase and (J) α-In2Se3, respectively. The yellow arrows indicate the intrinsics polarization directions in AFE β′-In2Se3. Scale bars, 50 μm (C), 2 μm (D), 2 1/nm in (E), 1 nm (F and G), and 2 nm (I and J), respectively.
Read more: https://www.science.org/doi/10.1126/sciadv.abo0773